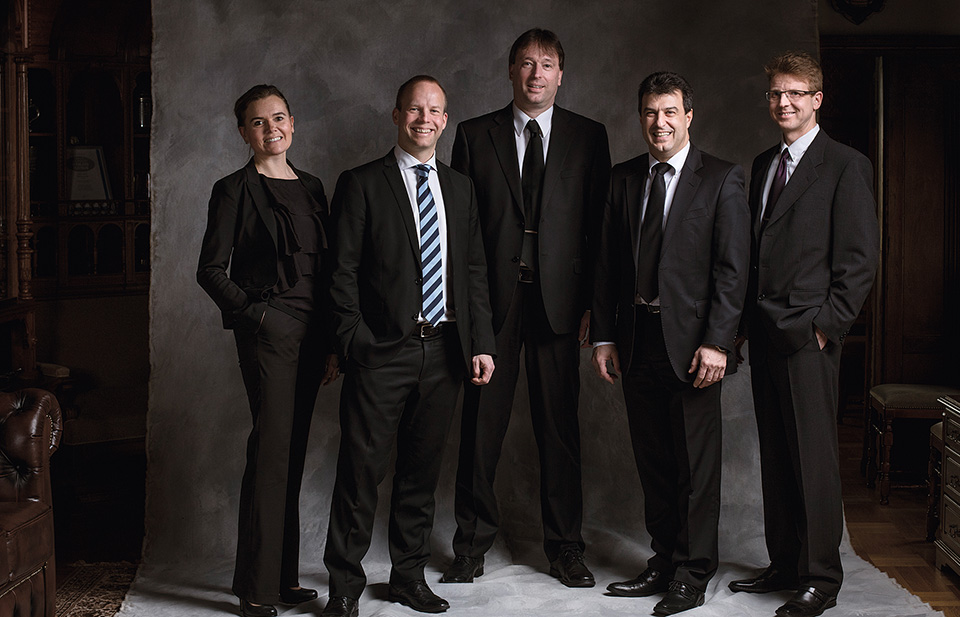
Nina Nyman
Marketing Director
Stefan Sjöberg
CEO
Mats Sundell
R&D Director, Deputy Chief Executive
Theo Sakalis
Business Development Director
Johan Palmroos
Quality Manager

Jan Torrkulla
Production Director
Olav Hellman
CFO
Simon Bloxham
VP Sales
Joachim Rännar
Head of Customer Service and Logistics
Kenneth Sundqvist
Personnel representative
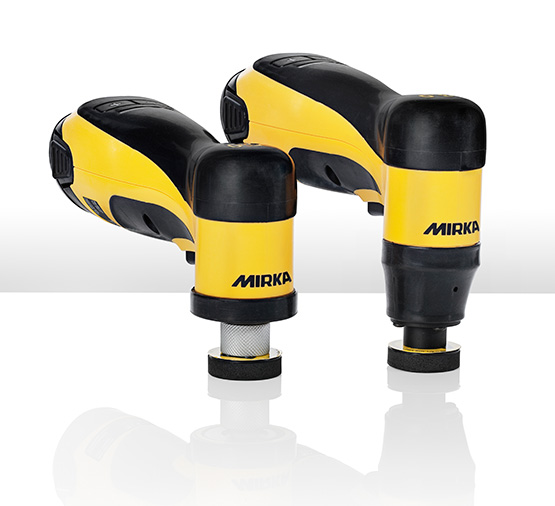
Mirka’s mission is to offer world-leading solutions for surface finishing – through blue-sky thinking, expert knowledge and a full range of technically superior abrasives and polishes, as well as new and innovative tool design.
Mirka’s total solutions create customer benefits and genuine advantages in the form of efficiency and high quality surface finishing, even for the most demanding challenges. This gives Mirka a unique position in the market.
Mirka has a strong global presence, with subsidiaries in 16 countries. The products are exported to around 100 countries, and over 96 % of sales are outside Finland’s borders.
Mirka has four factories in Finland. The Jepua and Oravainen units manufacture and convert Mirka’s abrasive paper, cloth, net and non-woven abrasives. At Karjaa, the textile-based material for net products is produced, and a totally new production unit came on stream during the year. The new factory in Pietarsaari produces micro-finishing products and polishing compounds. Electric sanders are also assembled at this facility. Wide and narrow belts are converted to meet central European requirements at the distribution centre in Belgium.
Top-quality and unique products
![]()
Constant improvement focusing on customers’ needs
![]()
Strong global presence and efficient logistics chain
| Mirka | 2016 | 2015 | 2014 | 2013 | 2012 |
| Turnover, EUR million | 239.7 | 233.3 | 206.2 | 190.2 | 176.0 |
| Change, % | 3 | 13 | 8 | 8 | 9 |
| Exports and foreign operations, % | 96 | 96 | 96 | 96 | 96 |
| Share of group turnover, % | 61 | 64 | 57 | 56 | 56 |
| Investments, EUR million | 16.8 | 20.1 | 12.3 | 21.8 | 9.7 |
| Personnel | 1108 | 1096 | 1072 | 995 | 957 |
turnover
personnel
capital employed