KWH
Logistics
THE ULTIMATE OBJECTIVE: TO MINIMIZE THE TOTAL COST OF LOGISTICS IN THE SUPPLY CHAIN
KWH Logistics is an independent Finnish service provider of global logistics solutions which help customers optimise the total costs of their supply chains.
KWH Logistics aims to be a preferred partner for its customers´ non-core logistics activities, both external (inbound, outbound) and in-plant (raw materials, finished goods). The KWH Group and KWH Logistics have sufficient resources to enhance and optimise the logistics process for customers interested in developing their logistics process for the long term. The ultimate objective is to minimize the total cost of logistics in the supply chain.
THE DEVELOPMENT OF KWH LOGISTICS 2015
KWH Logistics’ sales decreased because of reduced demand for raw materials for the steel industry. Volume growth in other parts of the Backman-Trummer Group compensated the downturn.
COLD STORAGE
Cold and chilled storage facilities and related handling services for foodstuff.
- KWH Freeze Ltd
FREIGHT FORWARDING
Global logistics solutions by different modes of transportation and related value adding services.
- Oy Backman-Trummer Ab
- Oy Moonway Ab
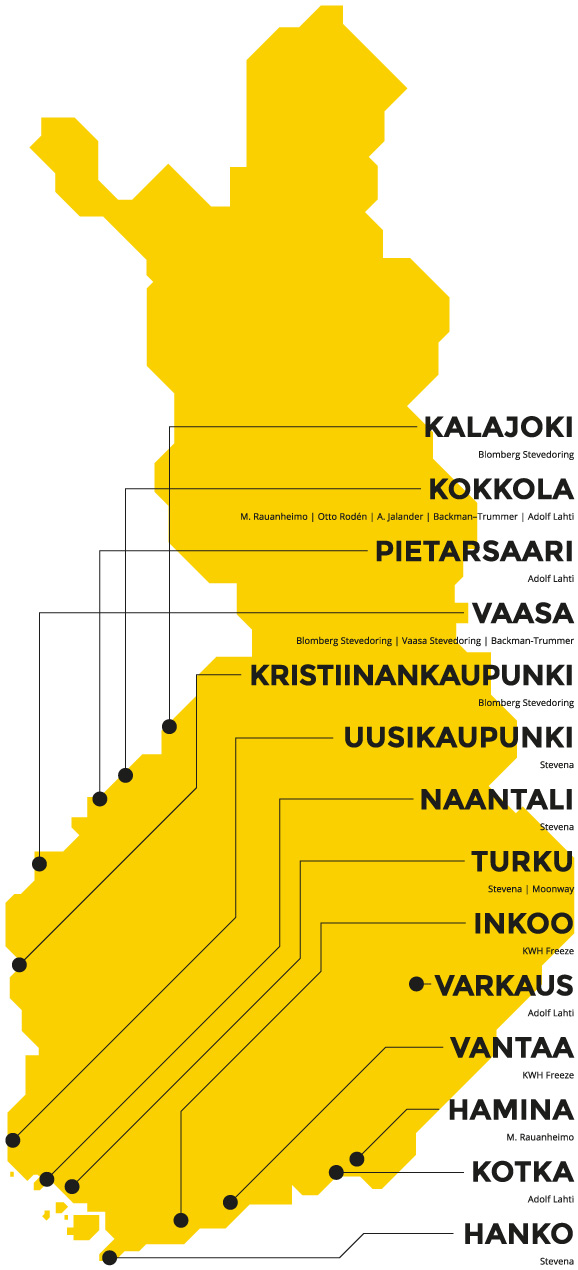
PORT & SEA
Port operations and related logistics solutions for both bulk and unitized goods as well as for project cargo
(heavy lift 200 tons).
- Oy Blomberg Stevedoring Ab
- Oy M. Rauanheimo Ab
- Stevena Oy
- Oy Otto Rodén Ab
- A. Jalander Oy
- Vaasa Stevedoring Oy
INDUSTRIAL SERVICES
Handling, storage, and transport of goods, construction excavation, workshop for heavy machinery, in-plant service logistics and other related operations.
- Oy Adolf Lahti Yxpila Ab
| KWH Logistics | 2015 | 2014 | 2013 | 2012 | 2011 |
| Turnover, EUR million | 114,4 | 138,1 | 132,5 | 110,7 | 111,9 |
| Change, % | -17 | 4 | 20 | -1 | 17 |
| Share of group turnover, % | 31 | 38 | 39 | 35 | 21 |
| Investments, EUR million | 7,6 | 15,2 | 14,2 | 12,5 | 15,4 |
| Personnel | 417 | 420 | 400 | 393 | 378 |
turnover
personnel
capital employed